Basic Rhythm Recognition Made Easy
Richard Purchon FRGS AC RODP
The electrocardiogram is one of the most useful diagnostic tools available in healthcare.
Within seconds it can provide information about:
- heart rate
- cardiac rhythm
- conduction abnormalities
- myocardial ischaemia
- myocardial infarction
- electrolyte disturbance
- drug effects
- ventricular hypertrophy
- the electrical axis of the heart
Yet ECG interpretation is often taught in a way that makes it appear considerably more complicated than it needs to be.
The key is not to look at an ECG and attempt to recognise the entire tracing at once.
Instead, break it down into a series of simple questions.
This article follows on from Understanding Adult Cardiac Surgery and introduces the electrical activity of the heart, the normal ECG waveform, common rhythm disturbances and a structured method for interpreting an ECG.
The Heart is Both a Pump and an Electrical Organ
The heart is usually described mechanically.
The atria fill.
The ventricles contract.
The valves open and close.
Blood moves through the pulmonary and systemic circulations.
But none of this can occur in a coordinated fashion without an electrical impulse.
The normal heartbeat begins with spontaneous electrical activity in the sinoatrial node — SA node.
The SA node is situated high within the right atrium, close to the junction with the superior vena cava.
It is the heart’s normal physiological pacemaker.
From here the electrical impulse spreads through the atrial myocardium.
Some of the impulse passes across to the left atrium through specialised interatrial pathways including Bachmann’s bundle.
The result is depolarisation of both atria.
The impulse subsequently reaches the atrioventricular node — AV node.
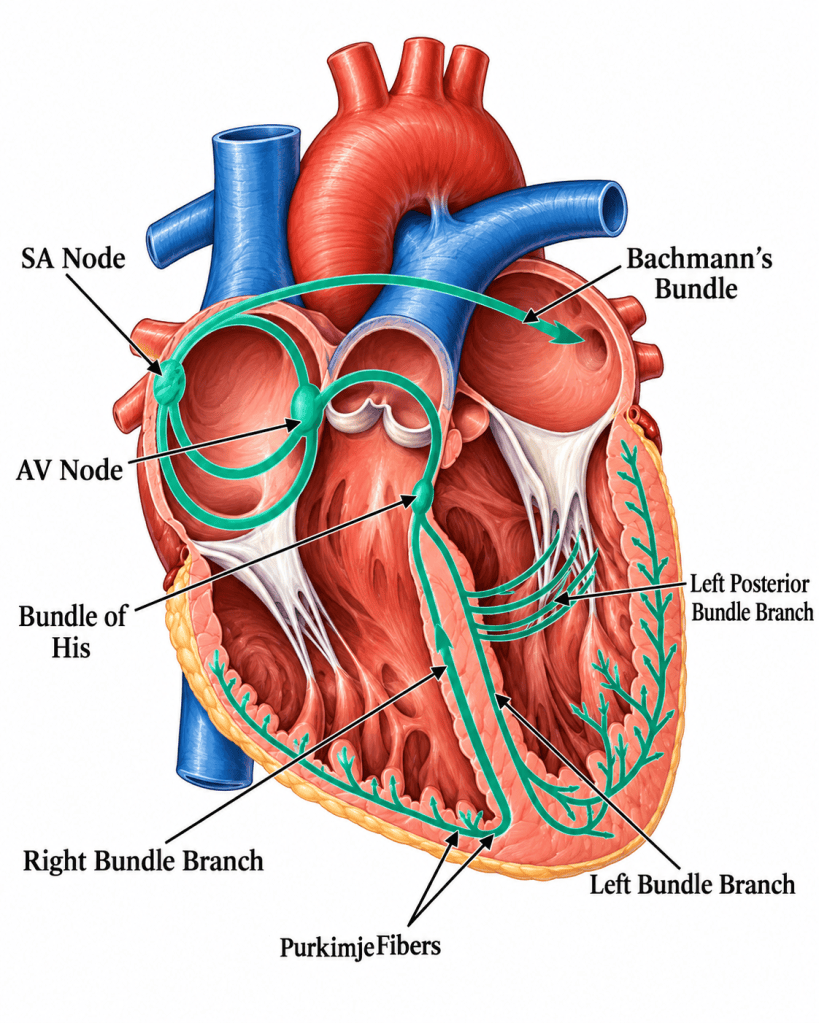
Normal cardiac conduction system showing the SA node, Bachmann’s bundle, AV node, Bundle of His, right and left bundle branches and Purkinje fibres.
The AV Node
The AV node has an important function.
Rather than transmitting the impulse immediately into the ventricles, conduction slows briefly.
This delay gives the atria time to complete their contraction and contribute to ventricular filling before the ventricles themselves contract.
From the AV node the electrical impulse enters the:
Bundle of His
and then divides into the:
Right bundle branch
and
Left bundle branch
The left bundle subsequently divides into fascicles that distribute electrical activity through the left ventricle.
Finally, the impulse enters the extensive network of Purkinje fibres within the ventricular myocardium.
This allows both ventricles to depolarise rapidly and in a coordinated manner.
In simplified form:
SA node → atria → AV node → Bundle of His → bundle branches → Purkinje fibres
Mechanical contraction follows electrical depolarisation.
What Does an ECG Actually Record?
An ECG does not directly measure contraction of the heart.
It records changes in electrical potential generated as myocardial cells depolarise and repolarise.
Electrodes placed on the patient’s skin detect these electrical changes from different directions.
An ECG therefore provides different electrical views of the same heart.
A standard 12-lead ECG uses ten electrodes to generate twelve electrical views.
These are:
Limb leads
- Lead I
- Lead II
- Lead III
Augmented limb leads
- aVR
- aVL
- aVF
Chest leads
- V1
- V2
- V3
- V4
- V5
- V6
Each lead looks at the electrical activity of the heart from a different direction.
This becomes particularly important when looking for myocardial infarction because changes occurring in anatomically related contiguous leads can indicate which region of myocardium is affected.
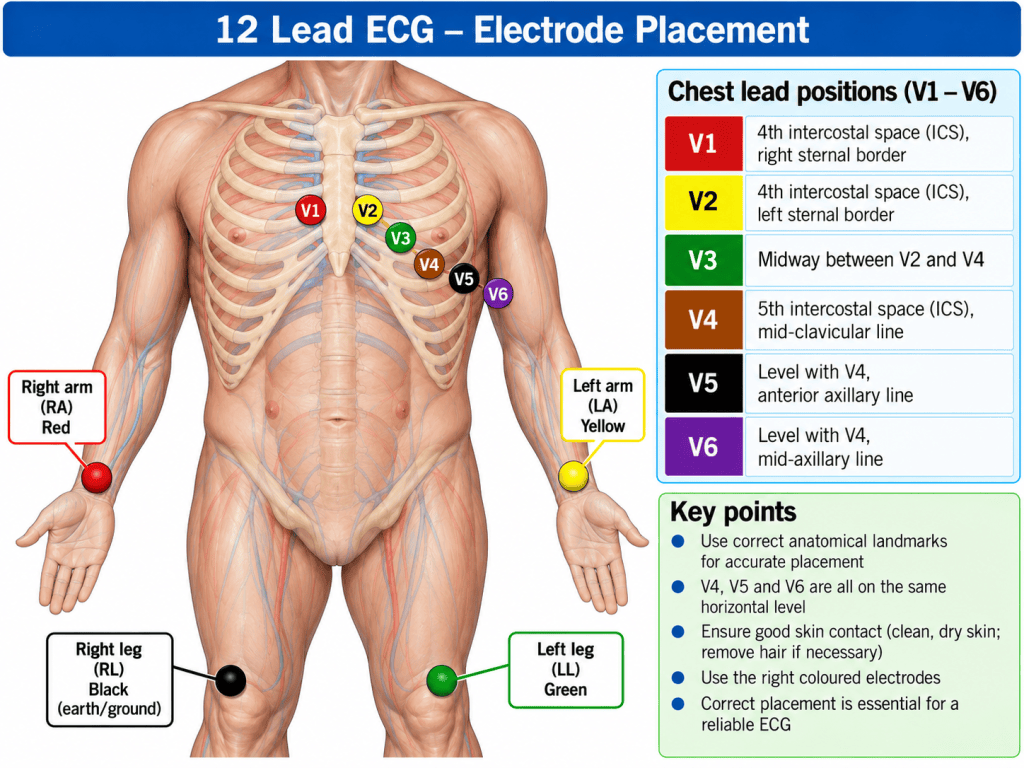
12-lead ECG electrode placement showing limb electrodes and positions V1–V6 across the chest.
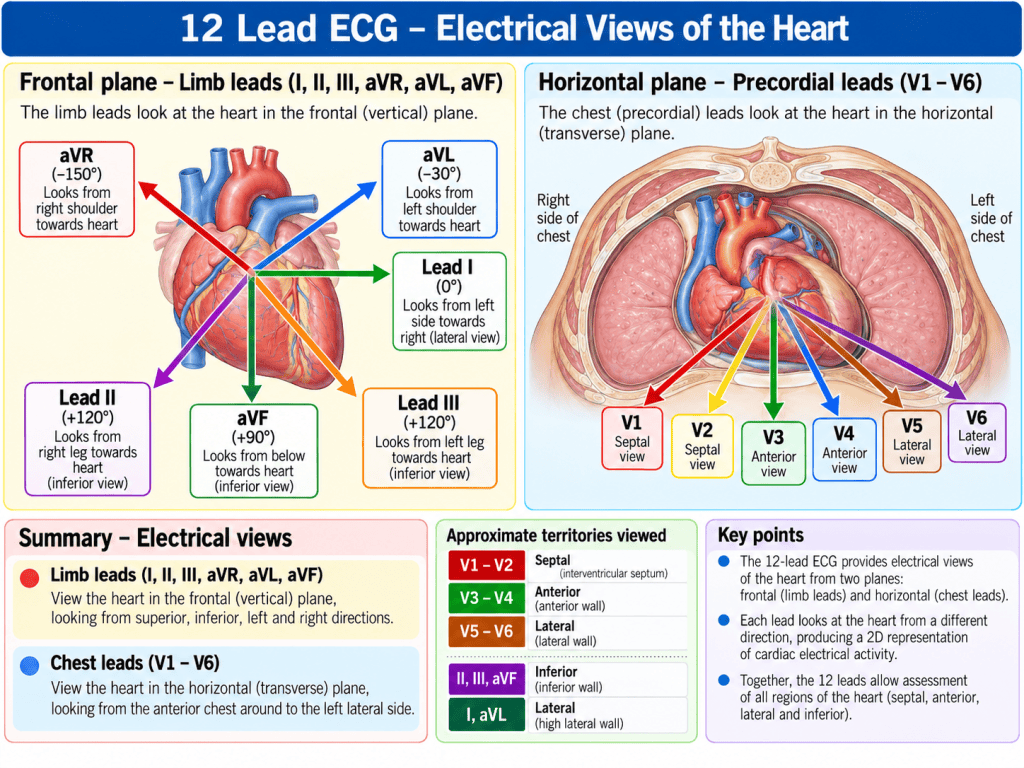
Diagram showing the electrical views of the heart provided by the limb, augmented and chest leads.
ECG Paper
Before interpreting the rhythm, it is essential to understand the paper.
At the standard recording speed:
25 mm per second
one small square represents:
0.04 seconds
and one large square represents:
0.20 seconds
Five large squares therefore represent:
1 second
Horizontally, ECG paper measures time.
Vertically, it measures voltage.
Standard calibration is normally:
10 mm = 1 mV
Before interpreting any ECG, therefore, confirm that the recording speed and calibration are appropriate.
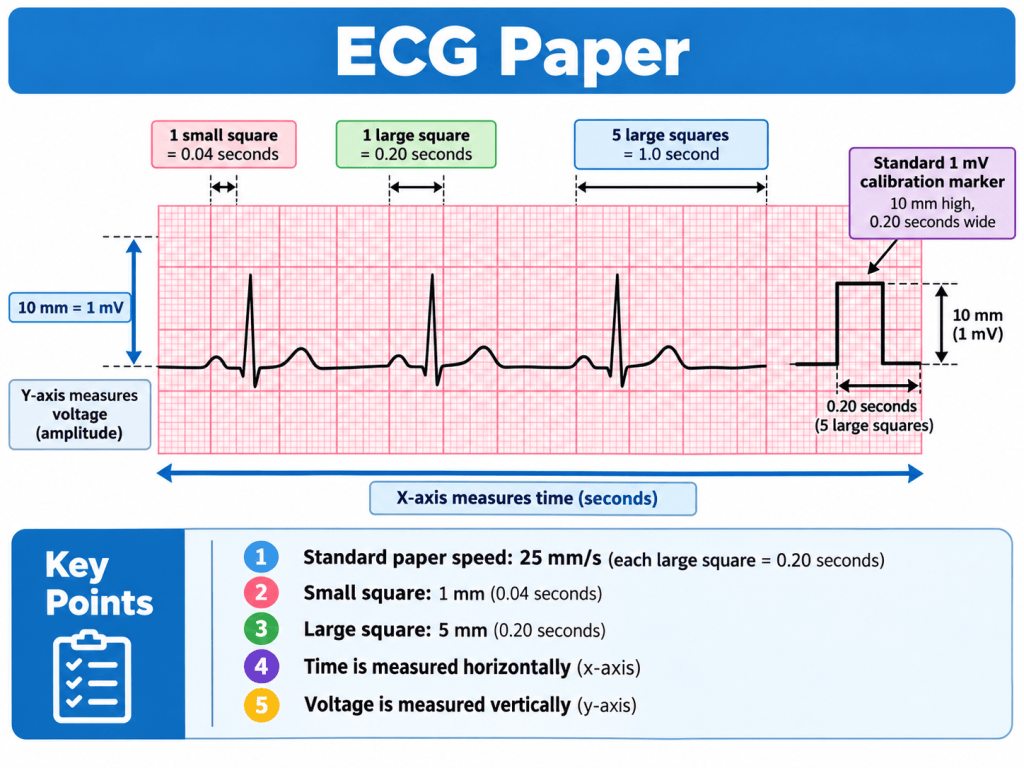
ECG paper showing small squares, large squares, time measurements and standard 1 mV calibration marker.
The Normal ECG Waveform
A normal cardiac cycle produces several recognisable components:
- P wave
- PR interval
- QRS complex
- ST segment
- T wave
A U wave may occasionally also be visible.
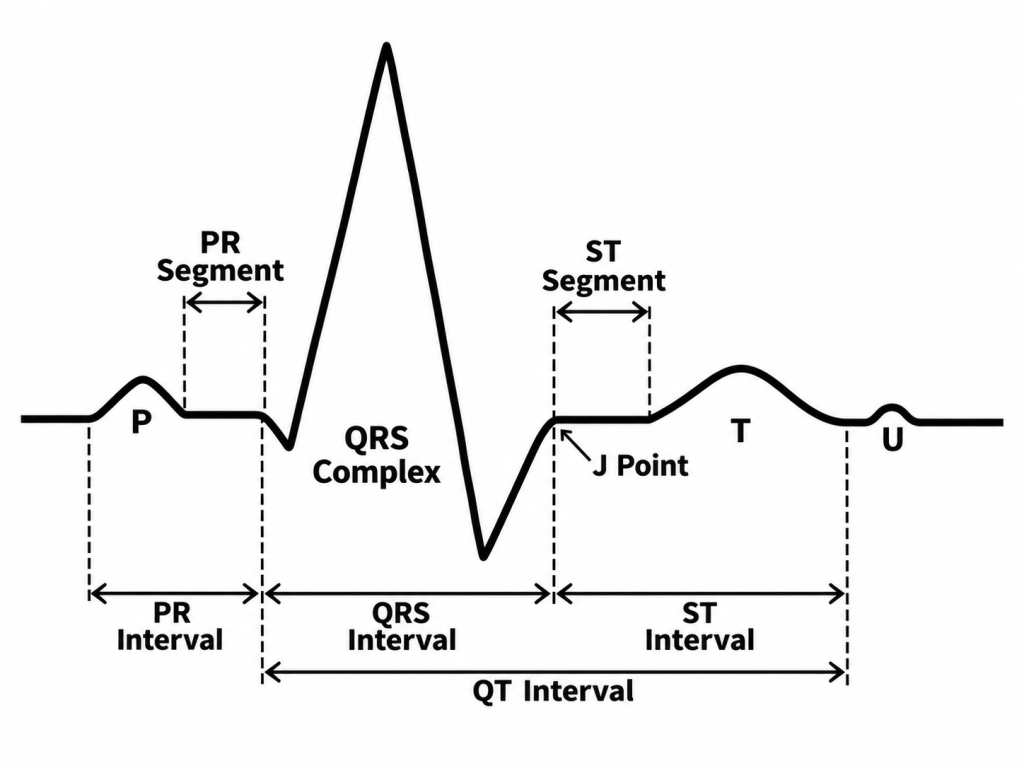
Normal ECG waveform labelled with the P wave, PR segment, PR interval, QRS complex, J point, ST segment, T wave, U wave and QT interval.
The P Wave
The P wave represents atrial depolarisation.
In normal sinus rhythm, the electrical impulse begins within the SA node and spreads through the atria.
Consequently, one of the first questions when examining a rhythm should be:
Are P waves present?
Then:
Does every P wave lead to a QRS complex?
And:
Does every QRS complex have a preceding P wave?
These simple questions immediately provide useful information about the relationship between atrial and ventricular activity.
The PR Interval
The PR interval is measured from the beginning of the P wave to the beginning of the QRS complex.
It represents conduction from the atria through the AV node and into the ventricular conduction system.
A normal adult PR interval is approximately:
0.12–0.20 seconds
or approximately:
3–5 small squares
A prolonged PR interval may indicate delayed AV conduction.
A changing relationship between P waves and QRS complexes may indicate a more significant conduction abnormality.
The QRS Complex
The QRS complex represents ventricular depolarisation.
Because ventricular conduction normally occurs rapidly through the His-Purkinje system, the QRS complex should be relatively narrow.
A broad QRS complex suggests that ventricular depolarisation is taking longer than normal.
Possible causes include:
- bundle branch block
- ventricular rhythm
- ventricular pacing
- electrolyte disturbance
- drug effects
- pre-excitation
QRS morphology is therefore extremely useful when determining where a rhythm originates.
The ST Segment
The ST segment follows ventricular depolarisation.
Under normal circumstances it is approximately isoelectric.
Significant deviation from the baseline may suggest myocardial injury or ischaemia, although numerous other conditions can also alter the ST segment.
ST elevation becomes especially important when it appears in an anatomically consistent pattern across contiguous leads in a patient with suspected acute coronary syndrome.
The T Wave
The T wave represents ventricular repolarisation.
Its appearance can be altered by:
- myocardial ischaemia
- electrolyte abnormalities
- ventricular hypertrophy
- bundle branch block
- medications
- other pathological states
T-wave changes should therefore never be interpreted in isolation.
The QT Interval
The QT interval extends from the beginning of ventricular depolarisation to the end of ventricular repolarisation.
In other words, it extends:
from the beginning of the QRS complex to the end of the T wave
The QT interval changes with heart rate and is therefore often expressed as a heart-rate-corrected value — QTc.
A markedly prolonged QT interval is important because it increases susceptibility to potentially dangerous ventricular arrhythmias.
A Structured Approach to ECG Interpretation
The easiest way to make ECG interpretation consistent is to use the same method every time.
The teaching framework used here consists of ten steps.
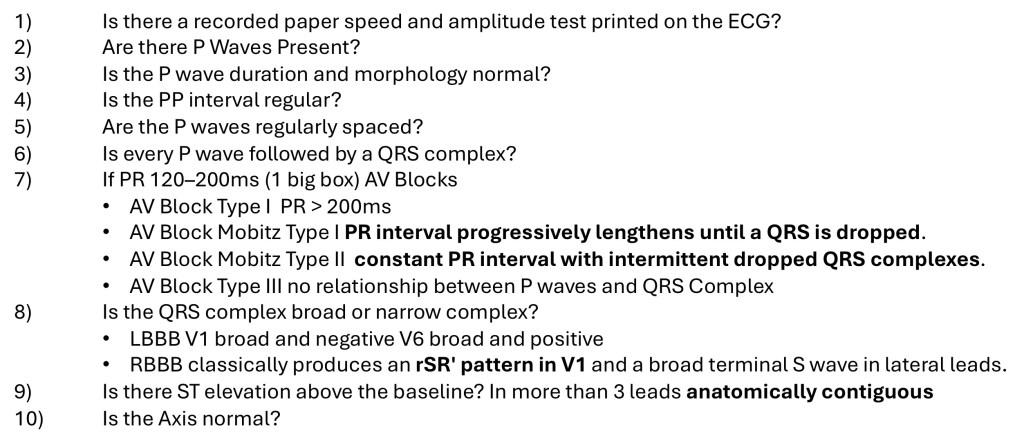
Ten-step ECG interpretation flowchart: Calibration → Rate → Rhythm → P waves → PR interval → AV block → QRS width → Bundle branch block → ST changes → Axis.
1. Check Calibration
Before interpreting anything else, confirm:
- paper speed
- voltage calibration
- signal quality
- artefact
A technically poor ECG can imitate genuine pathology.
2. Calculate the Heart Rate
Determine whether the heart rate is:
- normal
- slow
- fast
In an adult at rest, a sinus rhythm is commonly considered broadly normal between approximately:
60–100 beats per minute
A rate below this may represent bradycardia.
A rate above this may represent tachycardia.
Rate alone does not determine whether a rhythm is dangerous.
A patient with a rate of 45 may be completely stable.
A patient with a rate of 90 may be critically unwell.
Always interpret the ECG in conjunction with the patient.
3. Is the Rhythm Regular?
Look at the distance between successive QRS complexes.
Are the R–R intervals equal?
A regular rhythm produces relatively consistent intervals.
An irregular rhythm requires further assessment.
Ask whether it is:
regularly irregular
or
irregularly irregular
This distinction is particularly useful when considering rhythms such as atrial fibrillation.
4. Look at the P Waves
Ask:
- Are P waves present?
- Are they all the same shape?
- Is there one P wave before every QRS?
- Is there one QRS after every P wave?
- Are the P–P intervals regular?
The answers immediately tell us a great deal about atrial activity.
5. Measure the PR Interval
Is the PR interval normal?
Is it prolonged?
Does it remain constant?
Does it progressively increase?
Do some P waves fail to conduct?
These observations allow recognition of AV conduction abnormalities.
6. Look for AV Block
First-Degree AV Block
In first-degree AV block:
- every P wave is conducted
- every P wave is followed by a QRS
- the PR interval is prolonged beyond 0.20 seconds
It is therefore a delay rather than an actual failure of conduction.
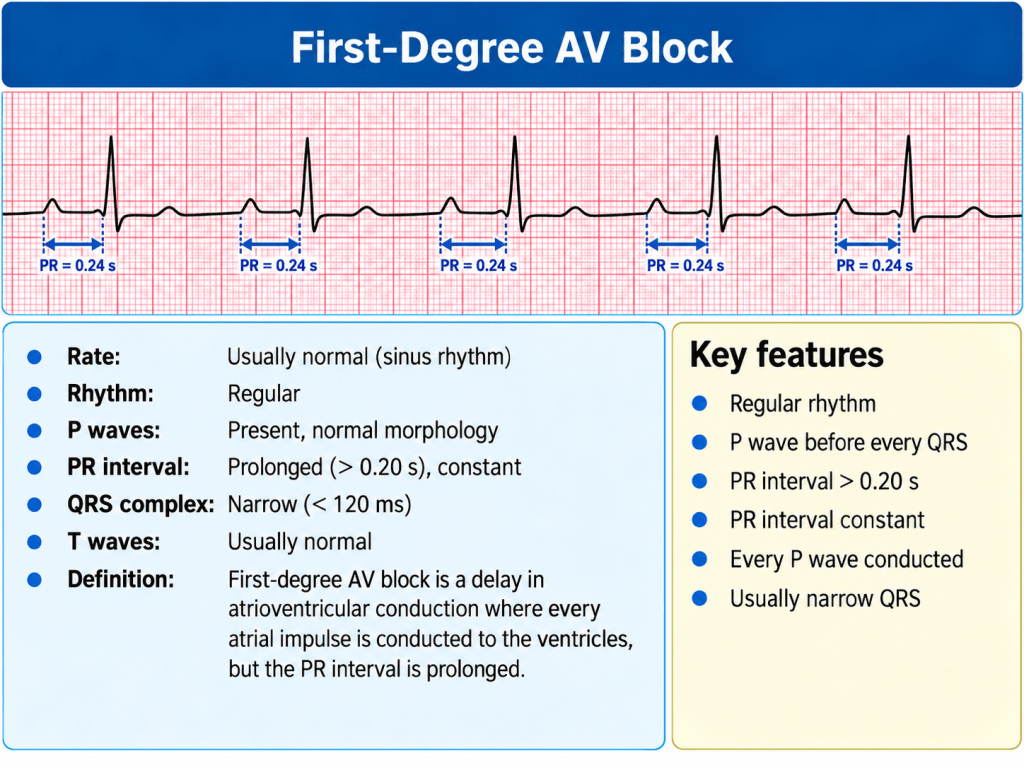
First-degree AV block rhythm strip showing prolonged but constant PR intervals.
Second-Degree AV Block — Mobitz I
Also known as Wenckebach.
The characteristic pattern is:
progressive prolongation of the PR interval → dropped QRS complex
The cycle then repeats.
A useful description is:
longer, longer, longer, drop.
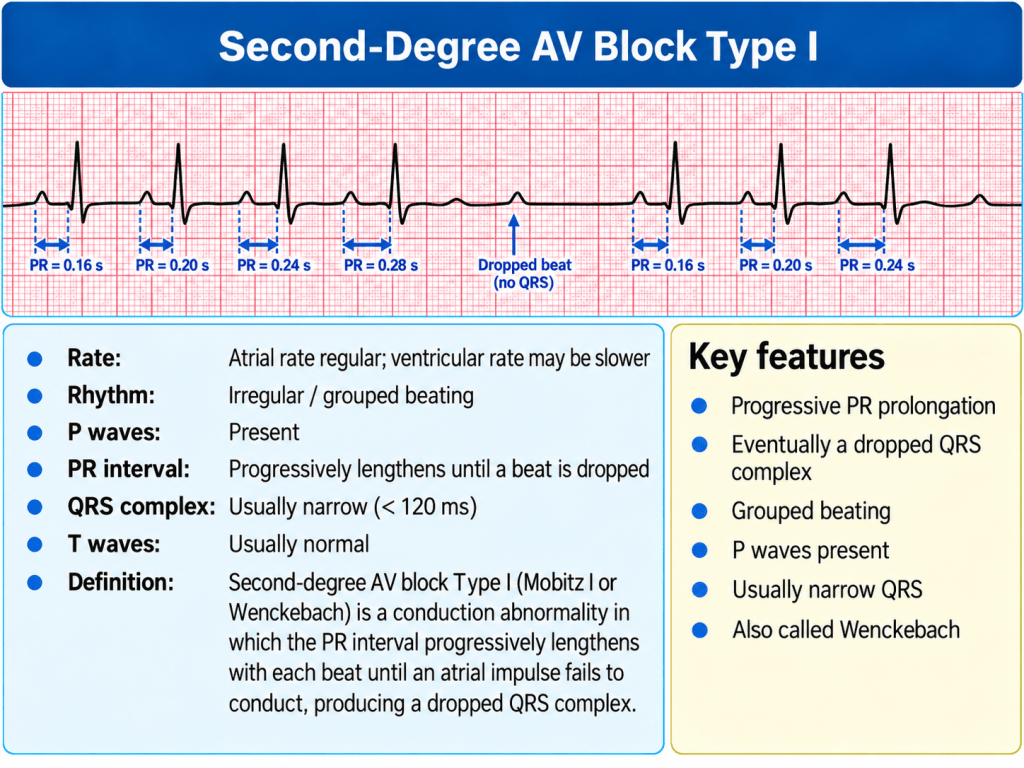
Mobitz I / Wenckebach rhythm strip showing progressively lengthening PR intervals followed by a dropped beat.
Second-Degree AV Block — Mobitz II
In Mobitz II:
- the PR interval of conducted beats remains relatively constant
- an occasional P wave is not followed by a QRS complex
There is therefore an intermittent failure of conduction without the progressive PR prolongation seen in Wenckebach.
Mobitz II is clinically important because it can progress to complete heart block.
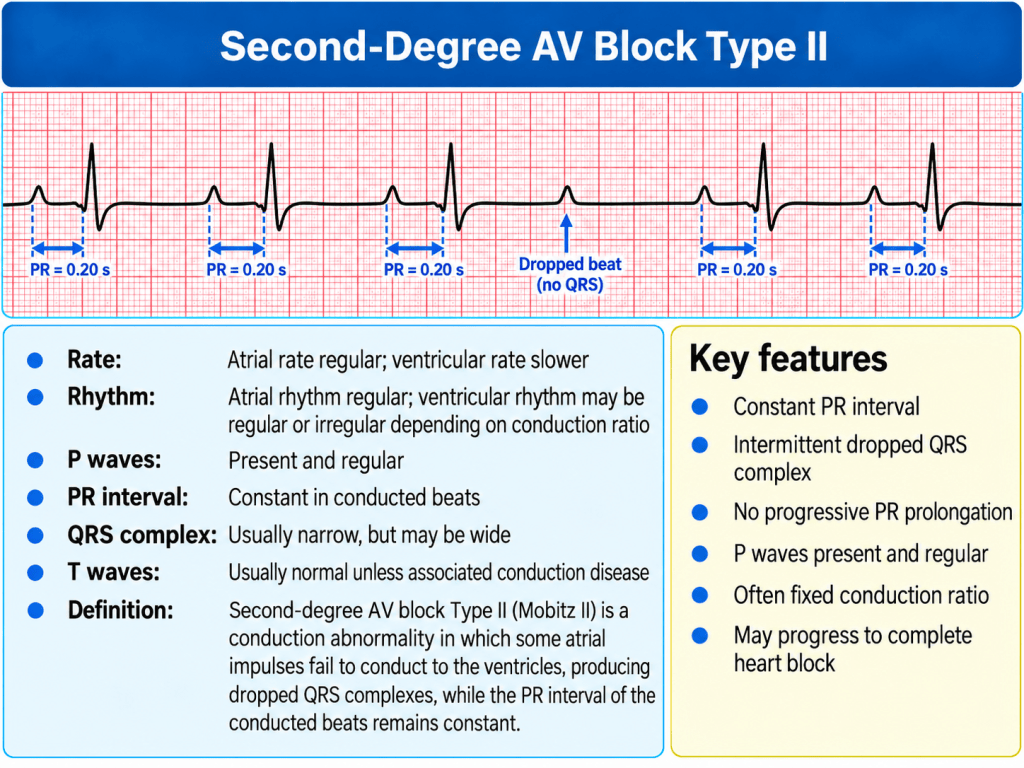
Mobitz II rhythm strip showing fixed PR intervals with intermittent non-conducted P waves.
Third-Degree AV Block
In complete heart block, atrial and ventricular electrical activity become independent.
P waves continue to occur.
QRS complexes continue to occur.
But there is no consistent relationship between them.
This is termed AV dissociation.
The ventricular rate is usually maintained by an escape pacemaker below the site of the block.
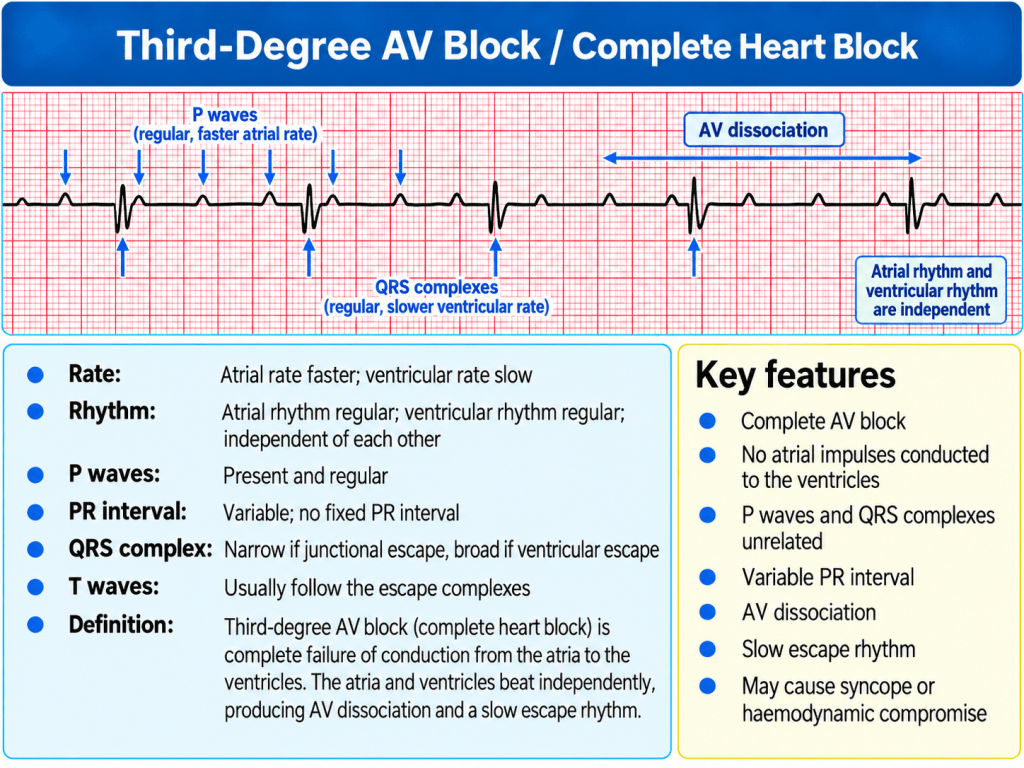
Third-degree AV block demonstrating independent P waves and QRS complexes.
7. Examine the QRS Complex
Ask:
Is the QRS narrow or broad?
A narrow QRS usually suggests that ventricular depolarisation is occurring through the normal His-Purkinje system.
A broad QRS suggests delayed or abnormal ventricular activation.
One possible cause is bundle branch block.
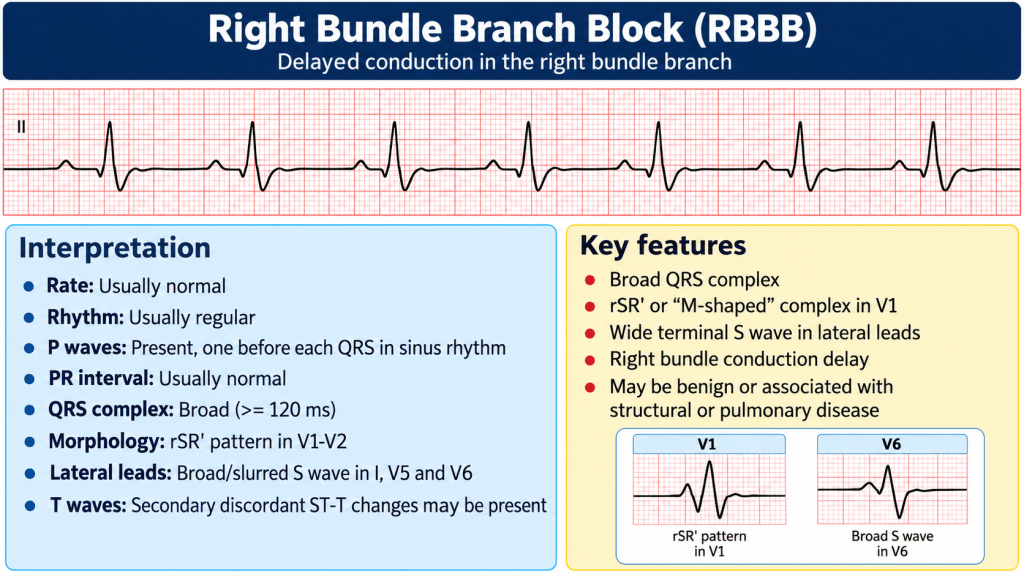
Comparison of a normal narrow QRS complex with a broad QRS complex. Typical RBBB morphology in V1 and V6.
Right Bundle Branch Block
In right bundle branch block — RBBB — conduction through the right bundle is delayed.
The left ventricle depolarises normally, followed by delayed depolarisation of the right ventricle.
Characteristic morphology is particularly evident in lead V1.
A useful traditional memory aid is:
MaRRoW
where the terminal pattern in V1 resembles an RSR′ configuration and lateral leads often show a broad terminal S wave.
The ECG should, however, be interpreted as a whole rather than relying solely upon a mnemonic.
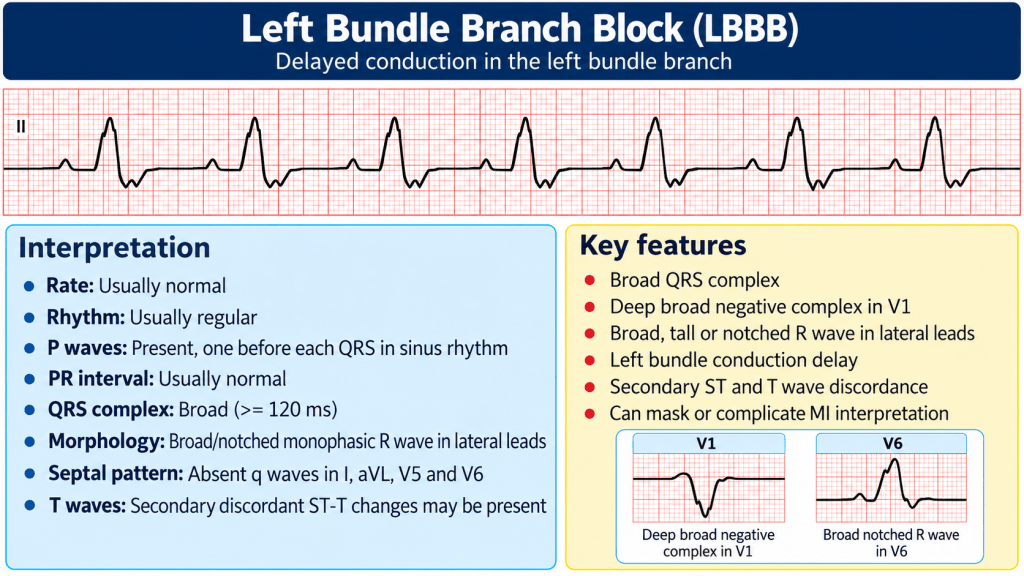
Left Bundle Branch Block Typical LBBB morphology in V1 and V6.
In LBBB, conduction through the left bundle is delayed.
The right ventricle activates first and the left ventricle subsequently depolarises through slower cell-to-cell conduction.
This alters both QRS morphology and repolarisation.
LBBB can make assessment of myocardial ischaemia considerably more difficult because it produces secondary ST and T-wave changes.
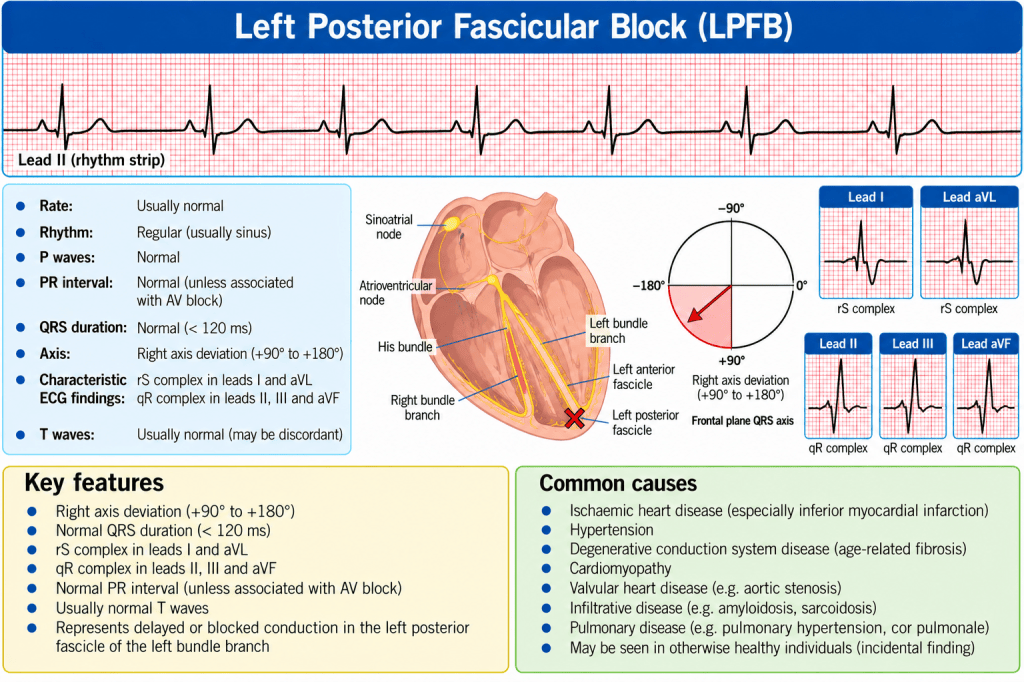
Bifascicular Block
A bifascicular block involves conduction failure in two of the major ventricular fascicles.
A common combination is:
Right bundle branch block + left anterior fascicular block
Recognition is important because more extensive conduction system disease may progress to higher-grade AV block.
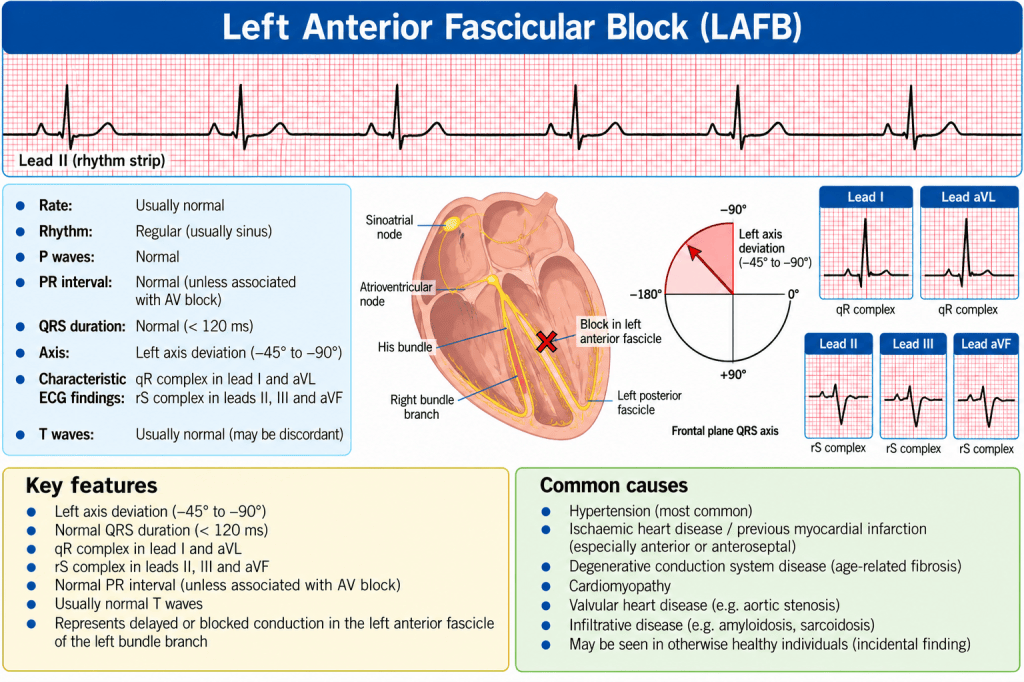
Bifascicular block showing RBBB with left-axis deviation/left anterior fascicular block.
8. Examine the ST Segment
Look for:
- ST elevation
- ST depression
- reciprocal changes
The changes should then be considered according to their anatomical distribution.
A single abnormal-looking lead should not automatically be called a myocardial infarction.
Patterns across anatomically related leads are much more significant.
Acute Coronary Syndrome
Acute coronary syndrome describes a spectrum of acute myocardial ischaemic conditions.
The clinically important groups include:
- unstable angina
- NSTEMI
- STEMI
The underlying mechanism commonly involves disruption of an atherosclerotic plaque followed by thrombus formation within a coronary artery.
The extent of coronary obstruction influences the resulting myocardial injury.
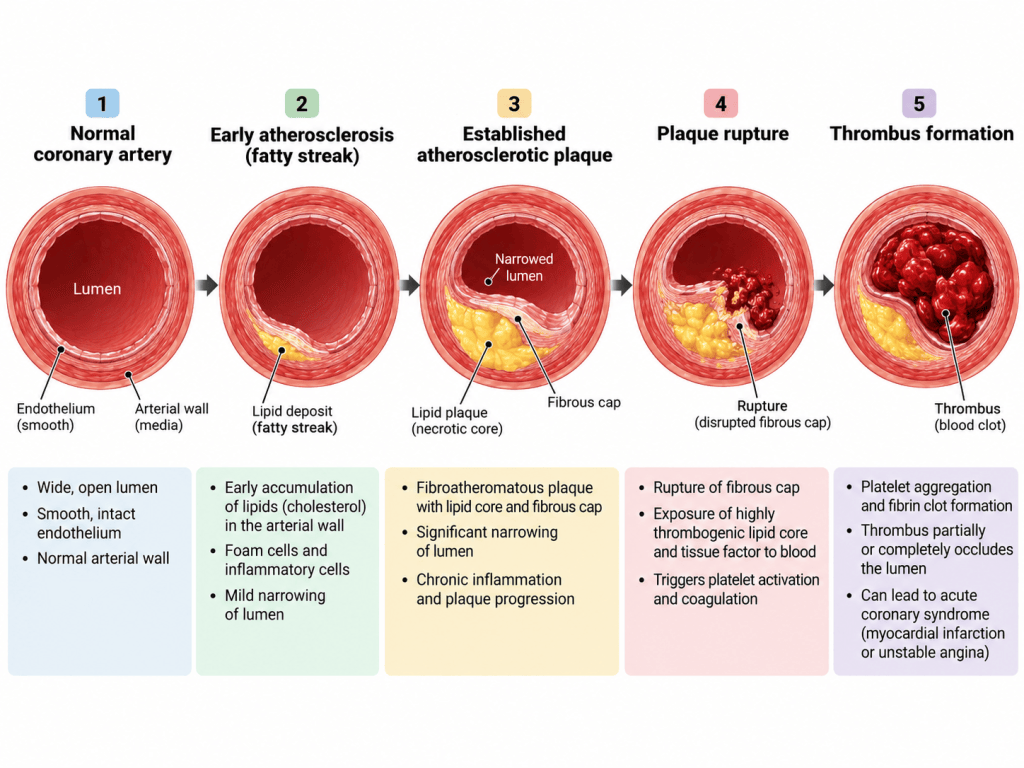
Coronary artery showing progressive atherosclerosis, plaque rupture and thrombus formation.
STEMI
ST-Elevation Myocardial Infarction is associated with acute myocardial injury producing characteristic ST elevation in anatomically related leads within the appropriate clinical context.
Different groups of leads correspond approximately to different areas of myocardium.
For example:
Inferior
- II
- III
- aVF
Anterior/septal
- V1–V4
Lateral
- I
- aVL
- V5
- V6
This relationship helps identify the region of myocardium affected and may give information about the likely coronary vessel involved.
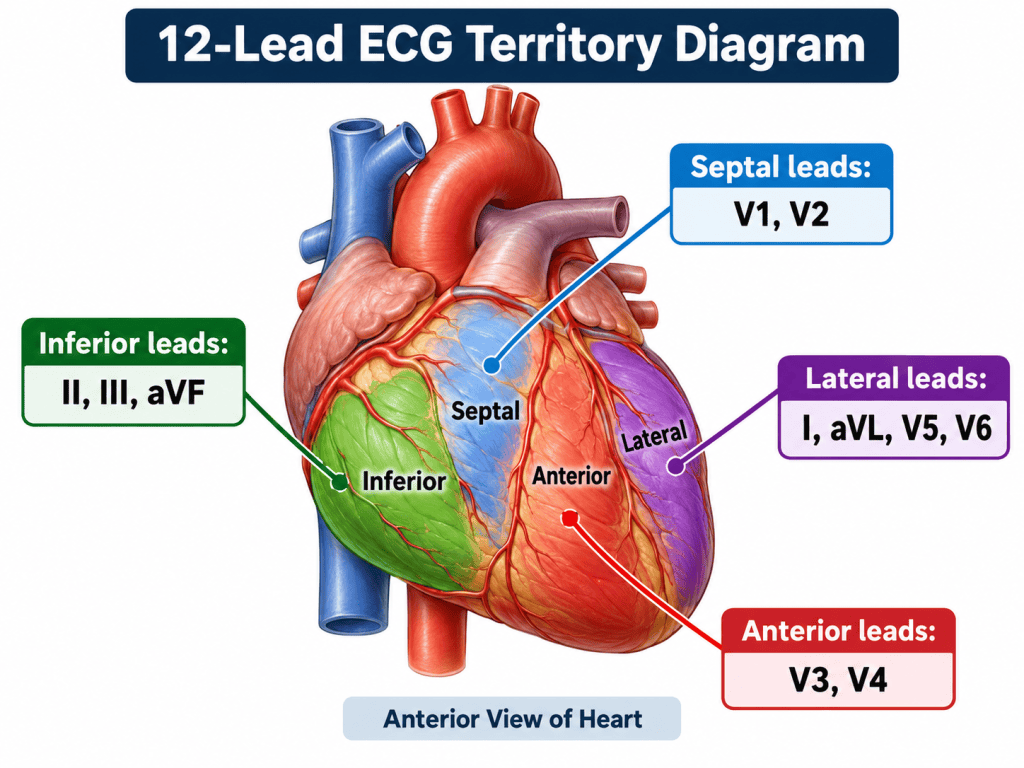
12-lead ECG territory diagram showing inferior, septal, anterior and lateral lead groups.
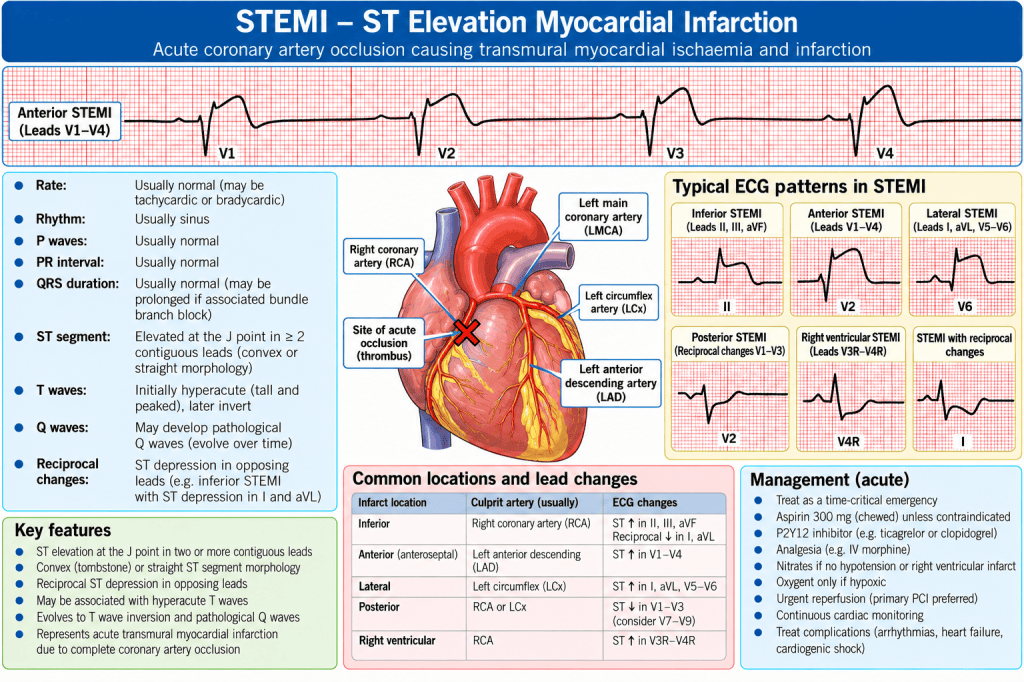
Example STEMI tracing demonstrating ST elevation in contiguous leads with reciprocal changes.
NSTEMI
A Non-ST-Elevation Myocardial Infarction does not produce the diagnostic ST-elevation pattern of STEMI.
The ECG may instead show:
- ST depression
- T-wave inversion
- non-specific changes
- or occasionally initially appear normal
The diagnosis depends upon the complete clinical picture, including symptoms, ECG findings and evidence of myocardial injury such as cardiac troponin.
The absence of ST elevation therefore does not mean that myocardial infarction has been excluded.
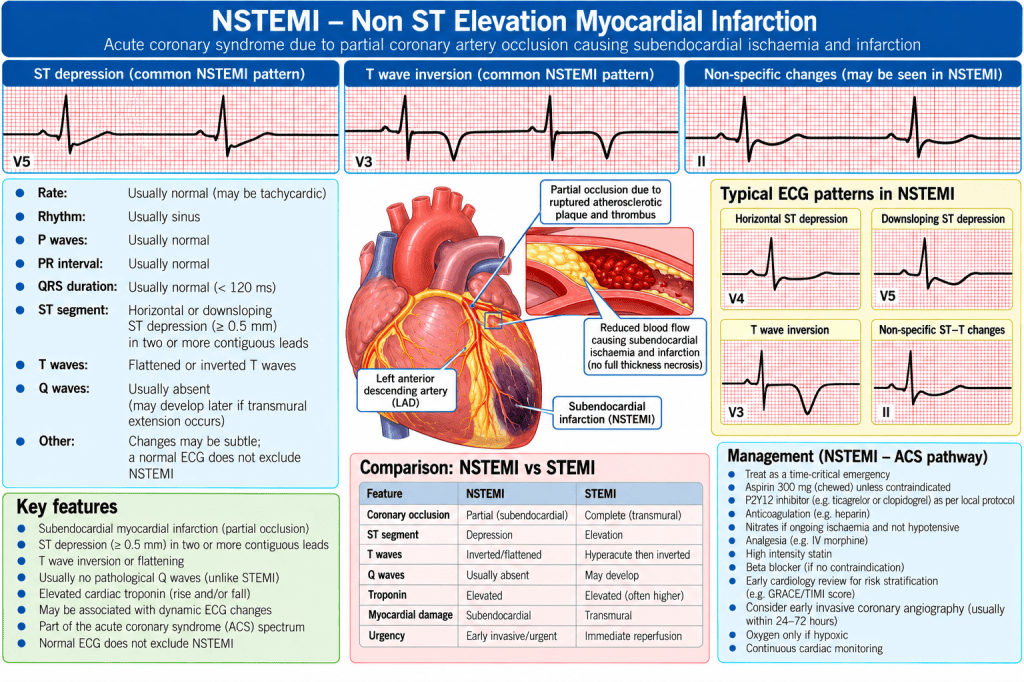
Example NSTEMI ECG showing ST depression and T-wave inversion without diagnostic ST elevation.
9. Determine the Cardiac Axis
The electrical axis describes the overall direction of ventricular depolarisation through the frontal plane.
This can initially seem complicated, but the basic principle is simple.
Electrical activity moving towards a lead produces a predominantly positive deflection.
Electrical activity moving away from a lead produces a predominantly negative deflection.
A quick axis assessment commonly begins by examining:
Lead I and aVF
If both are predominantly positive, the axis is usually within the normal quadrant.
Further analysis can identify:
- left-axis deviation
- right-axis deviation
- extreme-axis deviation
Axis changes may provide clues to conditions including:
- ventricular hypertrophy
- fascicular block
- pulmonary disease
- myocardial infarction
- altered ventricular conduction
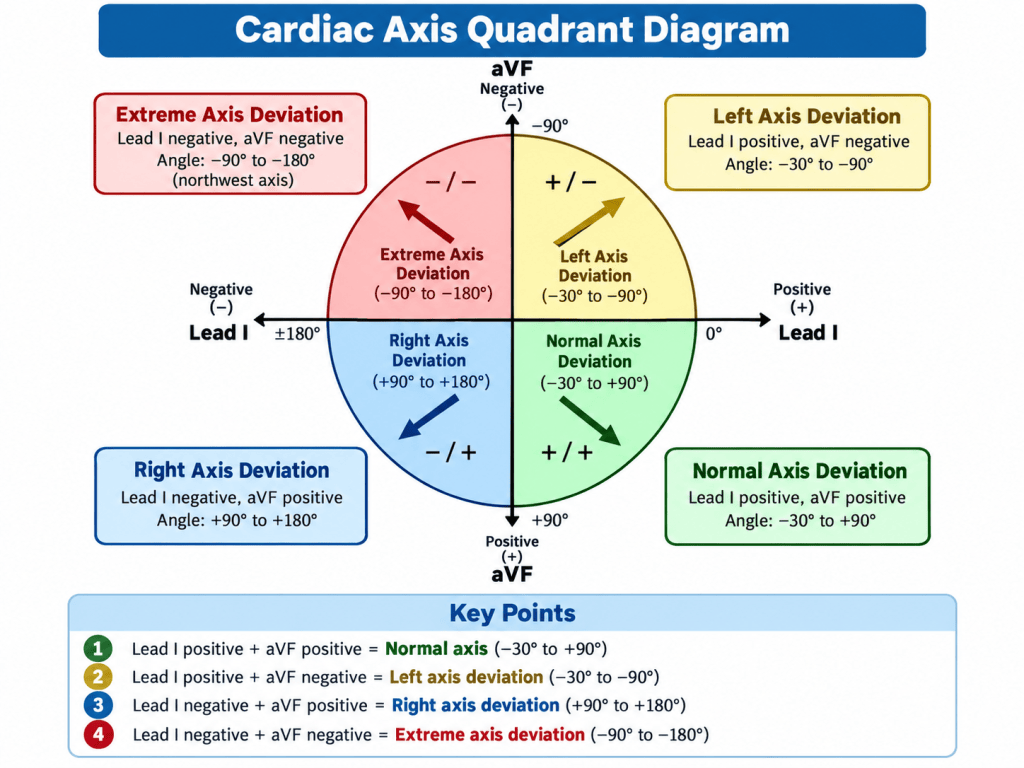
Cardiac axis quadrant diagram using Lead I and aVF to show normal axis, left-axis deviation, right-axis deviation and extreme-axis deviation.
10. Put Everything Together
Only after examining each component should the ECG be interpreted as a whole.
A final interpretation might therefore read:
Sinus rhythm at 76 bpm, normal PR interval, narrow QRS complexes, normal axis and no acute ST-segment abnormality.
Or:
Atrial fibrillation with a ventricular rate of 135 bpm, narrow QRS complexes and no acute ST elevation.
This is considerably more useful than simply saying:
“The ECG looks abnormal.”
Recognising Common Rhythms
Normal Sinus Rhythm
Normal sinus rhythm usually demonstrates:
- regular rhythm
- rate broadly between 60–100 bpm
- consistent P waves
- one P wave before each QRS
- consistent PR interval
- narrow QRS complexes unless another conduction abnormality exists
The important principle is that the rhythm originates from the SA node.
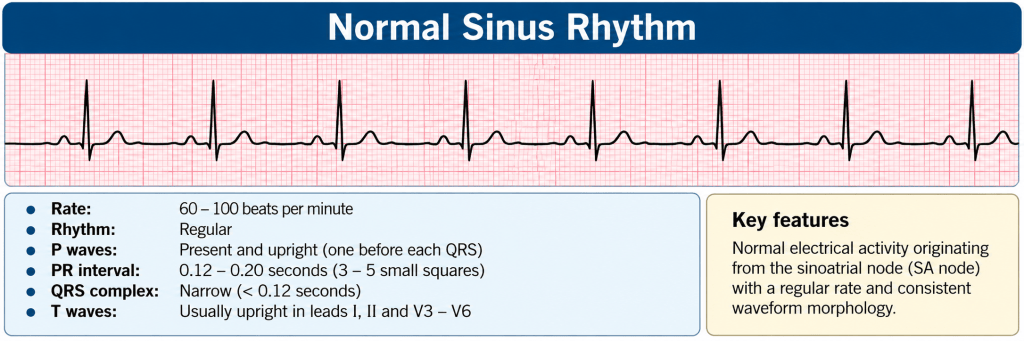
Normal sinus rhythm strip.
Sinus Bradycardia
Sinus bradycardia has all the features of sinus rhythm but at a slower rate.
Causes include:
- normal physiological variation
- athletic conditioning
- medications
- hypothermia
- inferior myocardial infarction
- conduction system disease
Treatment depends upon the patient’s clinical condition rather than the ECG number alone.
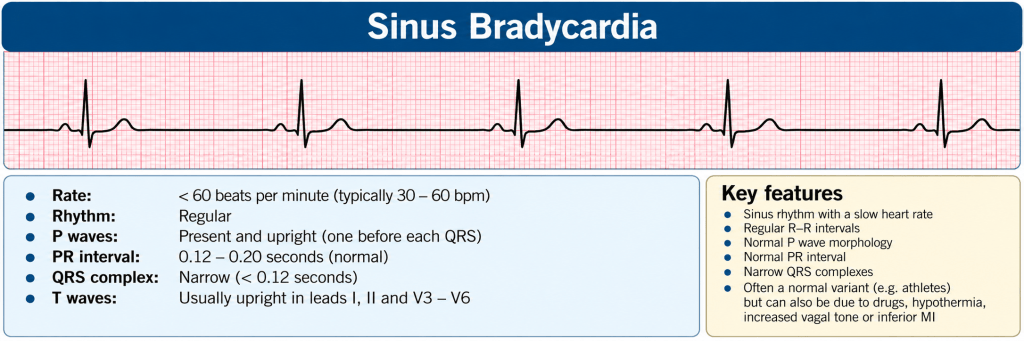
Sinus bradycardia rhythm strip.
Sinus Tachycardia
Sinus tachycardia is a sinus rhythm occurring at an increased rate.
Importantly, sinus tachycardia is usually a response to something rather than the primary problem.
Causes include:
- pain
- anxiety
- fever
- hypovolaemia
- sepsis
- anaemia
- hypoxia
- pulmonary embolism
- heart failure
Simply attempting to slow the heart without considering why it is fast can therefore be inappropriate.
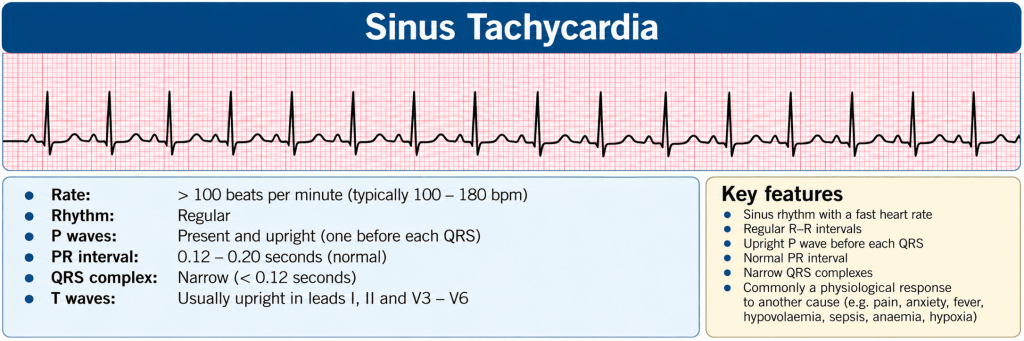
Sinus tachycardia rhythm strip.
Atrial Fibrillation
Atrial fibrillation — AF — results from disorganised atrial electrical activity.
Characteristic features include:
- absence of consistent P waves
- irregularly irregular ventricular rhythm
- variable R–R intervals
The atria are not contracting in a coordinated manner.
This produces several important consequences, including reduced atrial contribution to ventricular filling and an increased risk of thrombus formation within the atria.
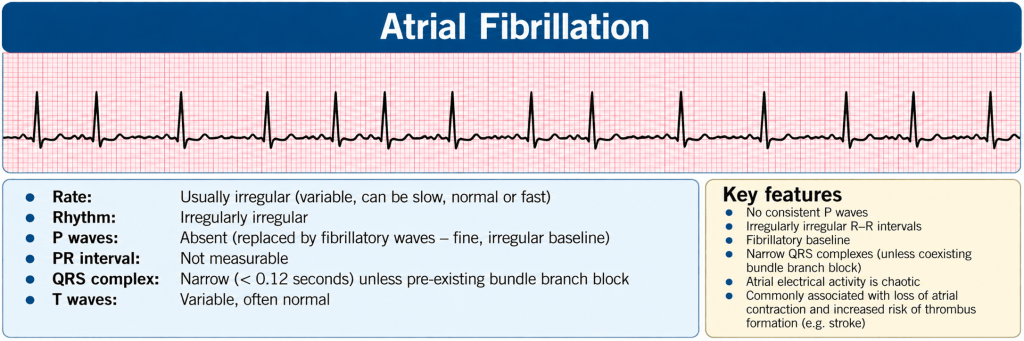
Atrial fibrillation rhythm strip showing absent organised P waves and an irregularly irregular ventricular response.
Atrial Flutter
Atrial flutter is caused by a rapid organised atrial re-entry circuit.
The atrial activity may produce characteristic saw-tooth flutter waves.
The AV node cannot normally conduct every atrial impulse, so conduction ratios such as:
- 2:1
- 3:1
- 4:1
may occur.
Atrial flutter can therefore produce either a regular or variable ventricular response depending upon AV conduction.
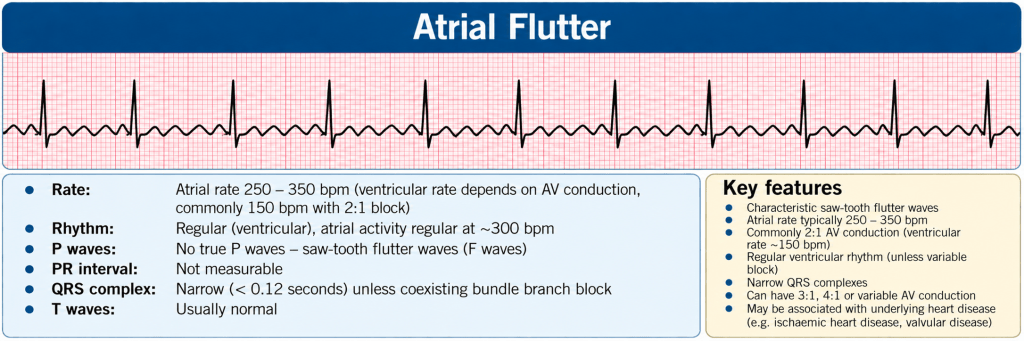
Atrial flutter rhythm strip showing characteristic saw-tooth flutter waves.
Supraventricular Tachycardia
The term SVT encompasses tachyarrhythmias originating above the ventricles.
A typical regular SVT may appear as:
- rapid
- regular
- narrow-complex
P waves may be difficult to identify because they are buried within the QRS complex or preceding T wave.
The clinical condition of the patient remains crucial when determining urgency of treatment.
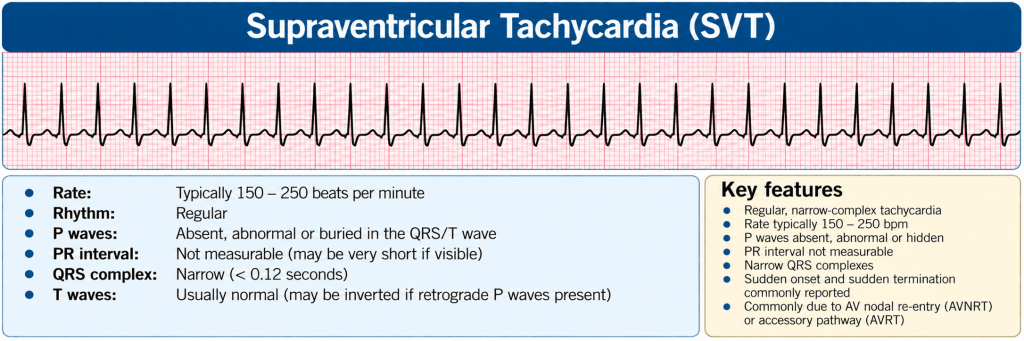
Regular narrow-complex supraventricular tachycardia rhythm strip.
Ventricular Tachycardia
Ventricular tachycardia — VT — originates within ventricular myocardium.
It is typically:
- rapid
- broad-complex
- regular
VT may occur with or without a pulse.
This distinction is fundamental.
Pulseless VT is a cardiac arrest rhythm.
Broad-complex tachycardia should be treated with considerable caution because misidentifying VT as SVT with aberrancy can have serious consequences.
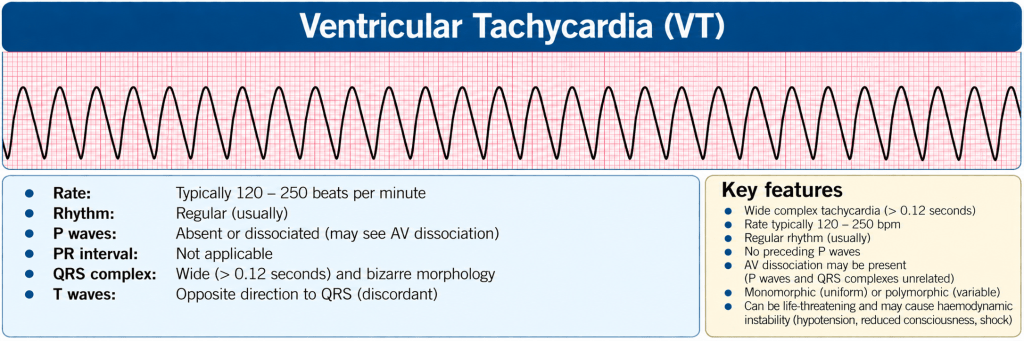
Monomorphic ventricular tachycardia rhythm strip.
Ventricular Fibrillation
Ventricular fibrillation — VF — represents completely disorganised ventricular electrical activity.
There is no coordinated ventricular contraction.
Therefore there is no effective cardiac output.
The ECG demonstrates chaotic electrical activity without recognisable organised QRS complexes.
VF is a cardiac arrest rhythm requiring immediate resuscitation and defibrillation according to current resuscitation protocols.
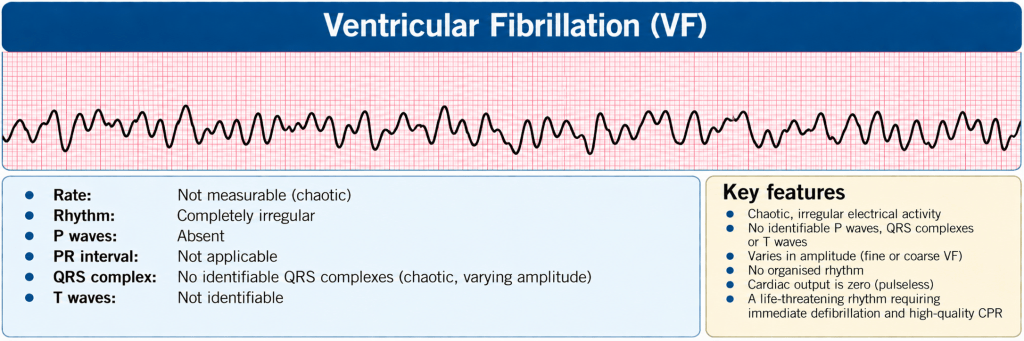
Ventricular fibrillation rhythm strip.
Asystole
Asystole represents the absence of ventricular electrical activity.
Before diagnosing asystole, always consider technical causes:
- disconnected leads
- poor electrode contact
- equipment failure
- very fine VF
Asystole is a non-shockable cardiac arrest rhythm.
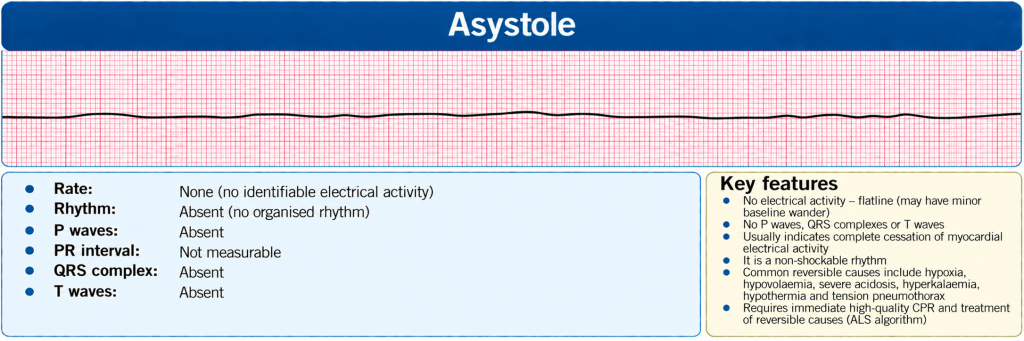
Asystole rhythm strip.
P-Wave Asystole
Occasionally atrial electrical activity continues while no ventricular complexes are generated.
P waves may therefore remain visible without associated QRS complexes.
This indicates profound failure of AV conduction or ventricular activation and should not be mistaken for an organised perfusing rhythm.
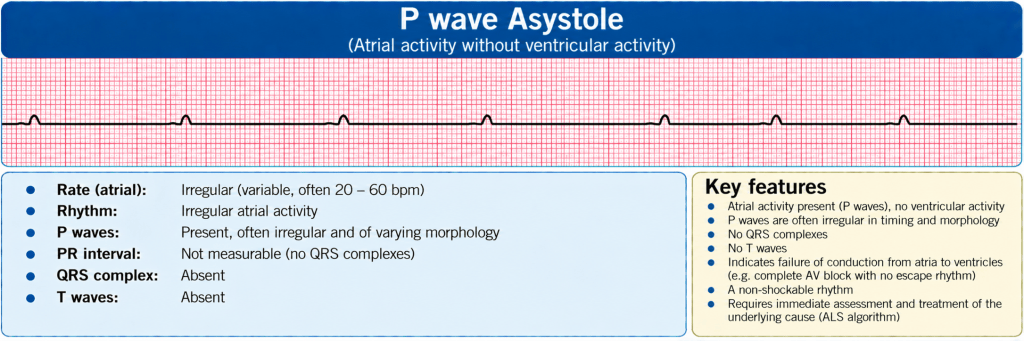
P-wave asystole showing atrial activity without ventricular QRS complexes.
Wolff-Parkinson-White Syndrome
Wolff-Parkinson-White syndrome — WPW — involves an accessory electrical pathway connecting atrial and ventricular myocardium.
The ventricular myocardium can therefore begin depolarising before normal AV nodal conduction has completed.
Classically this produces:
- shortened PR interval
- delta wave
- widened initial portion of the QRS
The clinical importance lies in the potential for tachyarrhythmias using the accessory pathway.
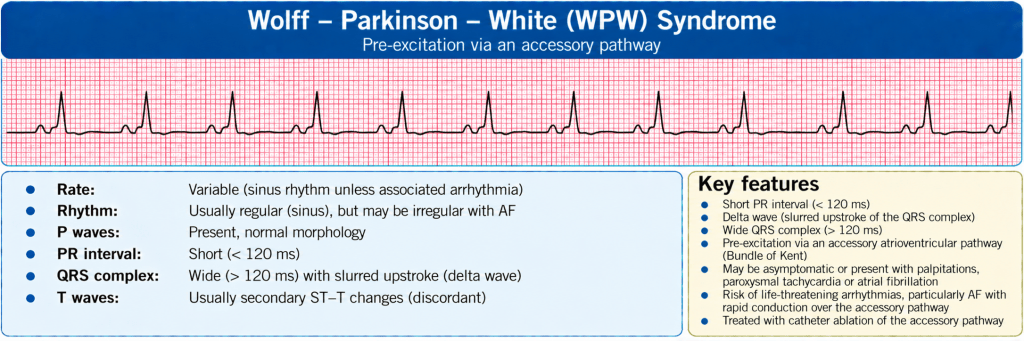
WPW ECG demonstrating a short PR interval and delta wave.
Artefact — The Rhythm That Isn’t There
Not every strange ECG represents cardiac disease.
Artefact can result from:
- patient movement
- shivering
- muscle tremor
- poor electrode contact
- electrical interference
- incorrectly positioned leads
Always look at the patient before treating the monitor.
A monitor may appear to show ventricular fibrillation while the patient is sitting up talking to you.
The patient’s condition always takes priority over the tracing.
ECG Lead Placement Matters
Poor electrode placement can dramatically alter an ECG.
Incorrect placement may:
- change QRS morphology
- alter R-wave progression
- imitate axis abnormalities
- create false ST changes
- suggest infarction where none exists
Accurate ECG interpretation therefore begins before the ECG is printed.
Good technique is part of diagnosis.
The ECG is Only Part of the Clinical Picture
Perhaps the most important lesson in ECG interpretation is this:
Treat the patient, not the tracing.
The ECG is evidence.
It must be interpreted alongside:
- symptoms
- observations
- haemodynamic condition
- medical history
- medications
- previous ECGs
- blood results
- physical examination
An apparently dramatic ECG can occasionally belong to a stable patient with a chronic abnormality.
A relatively subtle ECG can belong to a critically unwell patient with evolving myocardial infarction.
Context matters.
A Simple ECG Checklist
When presented with an ECG, work through the same sequence every time:
1. Calibration
Is the tracing technically adequate?
2. Rate
Fast, slow or normal?
3. Rhythm
Regular or irregular?
4. P waves
Are they present and consistent?
5. PR interval
Normal, prolonged or changing?
6. AV conduction
Are all atrial impulses conducted?
7. QRS
Narrow or broad?
8. ST segment
Elevation, depression or normal?
9. Axis
Normal or deviated?
10. Overall interpretation
What does the whole ECG tell us?
This systematic approach is much safer than relying upon pattern recognition alone.
One-page ECG interpretation checklist/algorithm showing the ten-step process.
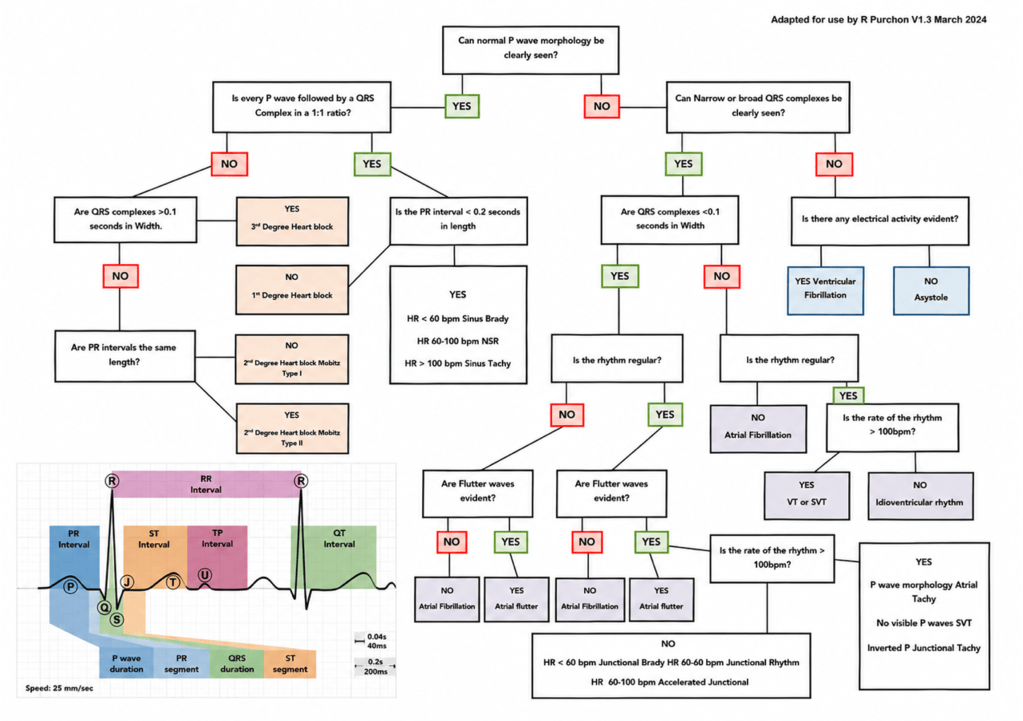
ECGs Made Easy
ECG interpretation becomes easier when the tracing is treated as a sequence of physiological events rather than a mysterious collection of lines.
The P wave is the atria depolarising.
The PR interval represents transmission of that impulse towards the ventricles.
The QRS complex is ventricular depolarisation.
The ST segment follows depolarisation.
The T wave represents ventricular repolarisation.
Once those basic events are understood, abnormal rhythms become variations on the same physiology.
The ECG therefore stops being something to memorise and becomes something that can be reasoned through.
And that is the real objective of basic rhythm recognition:
not simply to recognise a picture, but to understand what the heart is doing.
Glossary
AF — Atrial Fibrillation
Disorganised atrial electrical activity producing an irregularly irregular ventricular rhythm.
AV Node — Atrioventricular Node
Conductive tissue that receives the atrial impulse and delays transmission before ventricular activation.
BBB — Bundle Branch Block
Delayed or interrupted conduction through one of the ventricular bundle branches.
ECG — Electrocardiogram
Recording of cardiac electrical activity detected from the body surface.
LBBB — Left Bundle Branch Block
NSTEMI — Non-ST-Elevation Myocardial Infarction
PR Interval
Time from the beginning of atrial depolarisation to the beginning of ventricular depolarisation.
QRS Complex
ECG representation of ventricular depolarisation.
RBBB — Right Bundle Branch Block
SA Node — Sinoatrial Node
The heart’s normal physiological pacemaker.
STEMI — ST-Elevation Myocardial Infarction
SVT — Supraventricular Tachycardia
VF — Ventricular Fibrillation
VT — Ventricular Tachycardia
WPW — Wolff-Parkinson-White Syndrome

